
Analytical context your EHR can't give you.
Caliper layers your practice's own data with public national benchmarks (CMS Part B, Part D, MIPS, Open Payments) and our cross-EHR network - so you get peer comparisons more representative than any single EHR's reports and richer than any public-data benchmarking site. No patient data leaves your EHR. No PHI in our systems.
Free forever for the practice-footprint dashboard. Insights tier $149/practice/month with a 14-day trial.
Context. Comparisons. No charts to wade through.
Practice administrators and lead clinicians get a single dashboard answering one question: how does my practice compare to peers in the same specialty and region?
Custom-cohort peer benchmarking
Slice the benchmark the way you actually run your practice - specialty × region × practice size. Not the lump-sum 'all customers' average your EHR shows you.
No-show + cancellation heatmaps
See exactly which day-of-week and time-slot bleeds the most revenue, and how your no-show rate stacks up against peer practices in your specialty.
Staffing + productivity benchmarks
Encounters per clinician, encounters per support FTE, panel size by clinician - peer-comparable in real time. The MGMA Compensation Survey, but live and free of self-report bias.
Payer-mix snapshot
Where you collect well, where you don't, where you under-perform peers. Live and longitudinal, not an annual MGMA PDF.
Adherence flags by drug class
Population-level adherence patterns that quality-measure tools surface as a single MIPS score. We give you the cohort drift, not just the number.
Specialty footprint context
How your clinician + patient distribution compares to the national specialty norm. Free forever.
Four screens that answer one question.
The free dashboard, the paid Insights views, and the in-product data-permissions card - what every Caliper customer can see on day one. Aggregate counts only; every number is cell-size floored at 11.
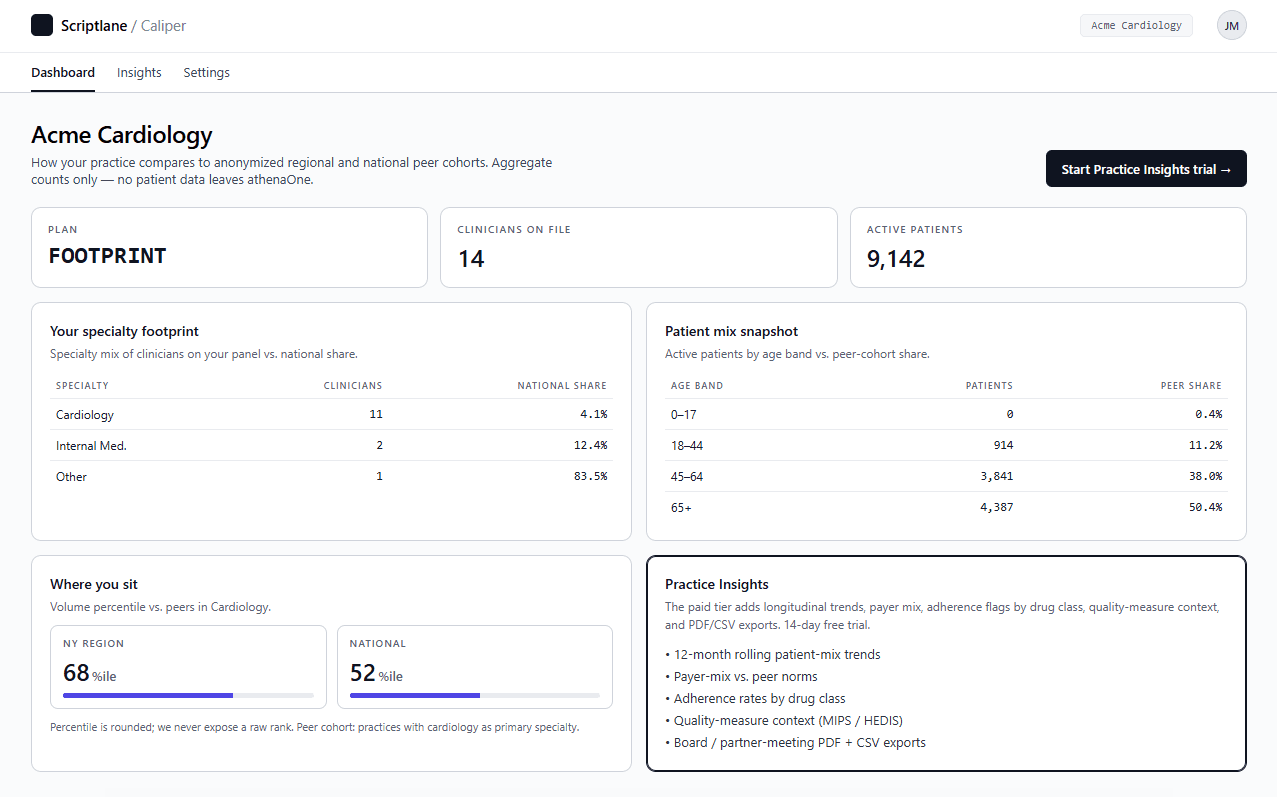
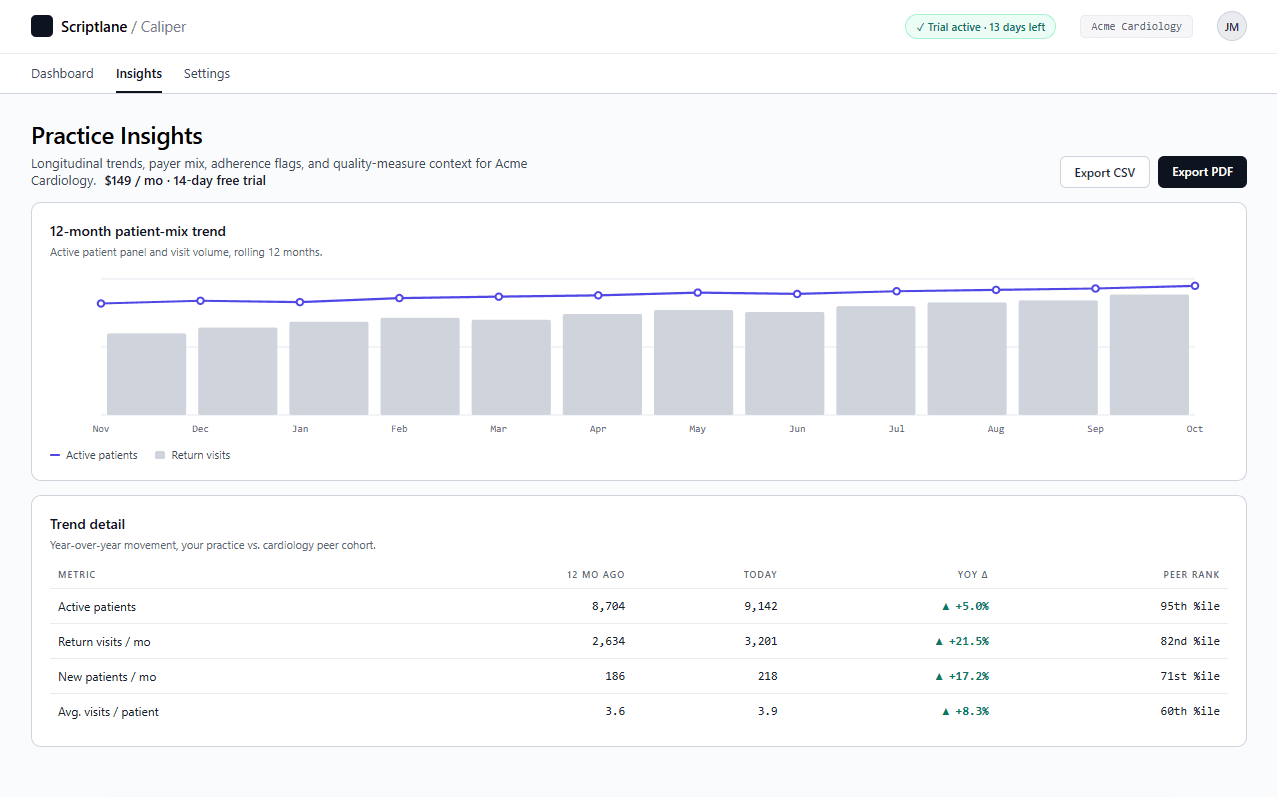
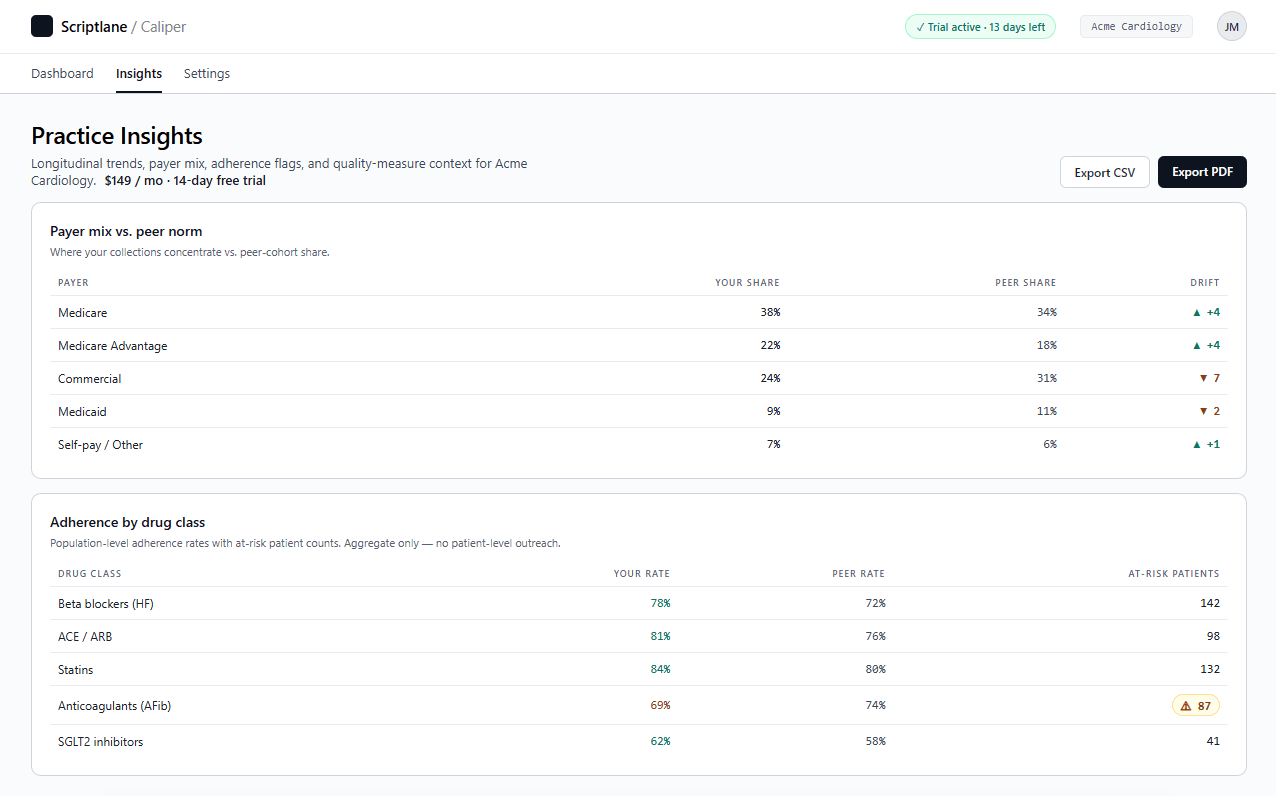
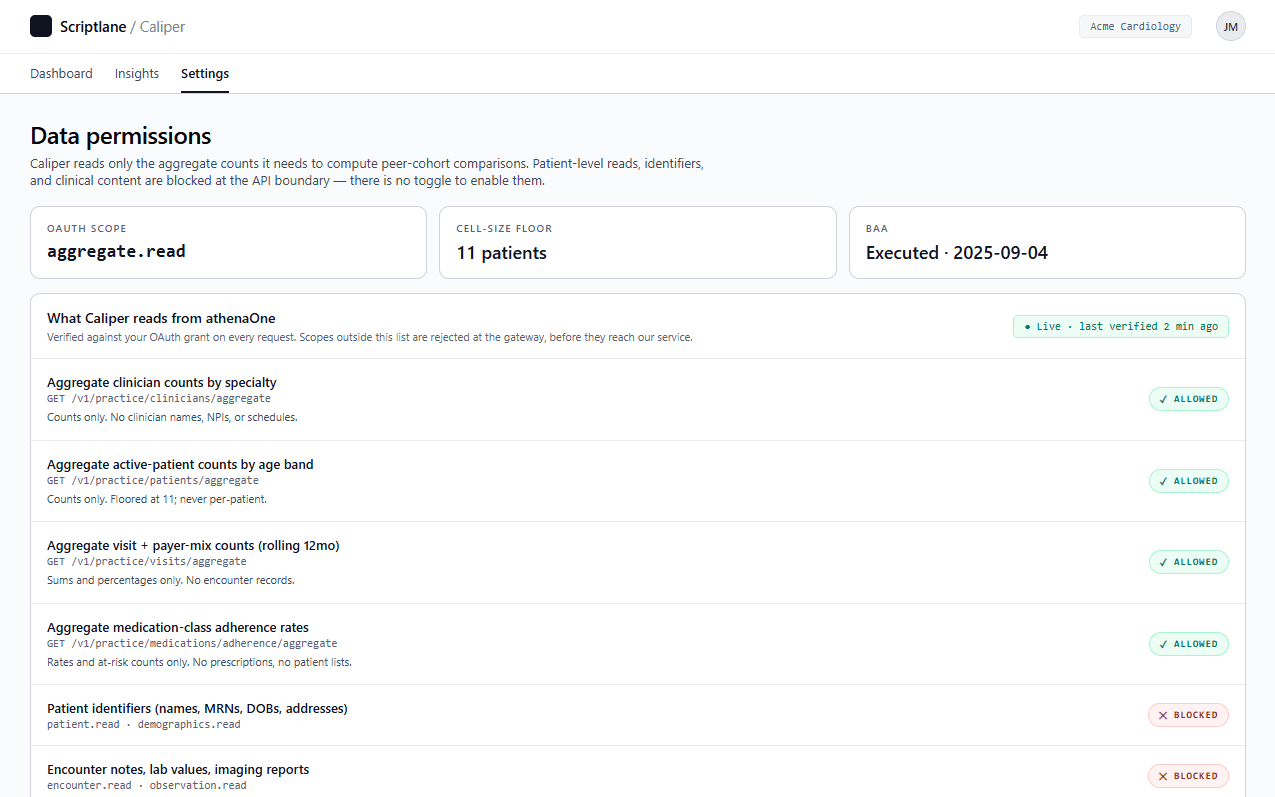
Aggregate-only. PHI never enters our systems.
The same security architecture our pharma-side product uses, applied to provider-side reads. Designed to clear marketplace review on the first pass.
- No PHI ever leaves your EHR. Aggregate counts only, cell-size floored at the API boundary.
- PHI-coded fields (mrn, patient_id, dob, diagnosis) rejected at the boundary by an explicit deny list.
- Optional NPI list match runs inside an AWS KMS-backed enclave with per-tenant key derivation. Whitepaper at /trust/match-filter.
- Append-only audit log of every read. Customer-facing audit dashboard in-app.
- BAA-ready. SOC 2 Type I in progress.
Free for the footprint dashboard.
Free tier ships value on day one. Practice Insights ($149) adds custom cohort slicing, no-show heatmaps, staffing benchmarks, payer-mix, adherence, and a quarterly trend report. Practice Pro ($349) adds payer-contract intelligence, quality-measure trajectory, referral analytics, and a monthly trend report - for practice owners running active negotiation, MIPS, and referral-network cycles.
- • Specialty + patient mix vs. national norm
- • Regional rank percentile
- • Up to 3 admin seats
- • In-app audit trail
- • Everything in Footprint, plus:
- • Custom-cohort peer benchmarking (specialty × region × size)
- • No-show + cancellation heatmaps, peer-benchmarked
- • Staffing-ratio + productivity benchmarks
- • Payer-mix snapshot vs. peer norms
- • Adherence flags by drug class
- • Longitudinal trends (12-month rolling)
- • Quarterly 12-month trend report (auto-emailed PDF)
- • Exportable PDF + CSV reports
- • Up to 10 seats
- • Everything in Insights, plus:
- • Payer-contract intelligence - per-CPT reimbursement vs. peer median + renewal flags
- • Quality-measure trajectory - predictive vs. MIPS / HEDIS thresholds
- • Referral-pattern analysis - outbound referrals + network leakage
- • Monthly trend report (vs. quarterly in Insights)
- • Unlimited admin seats
- • Priority email support